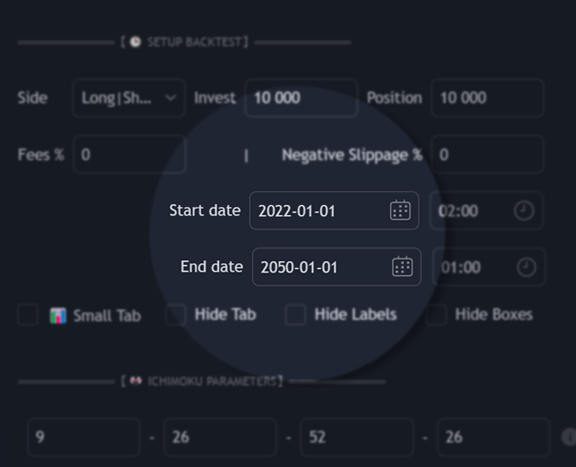
Backtest, optimize and run crypto trading strategies super-easily, all with a single powerful Tradingview indicator!
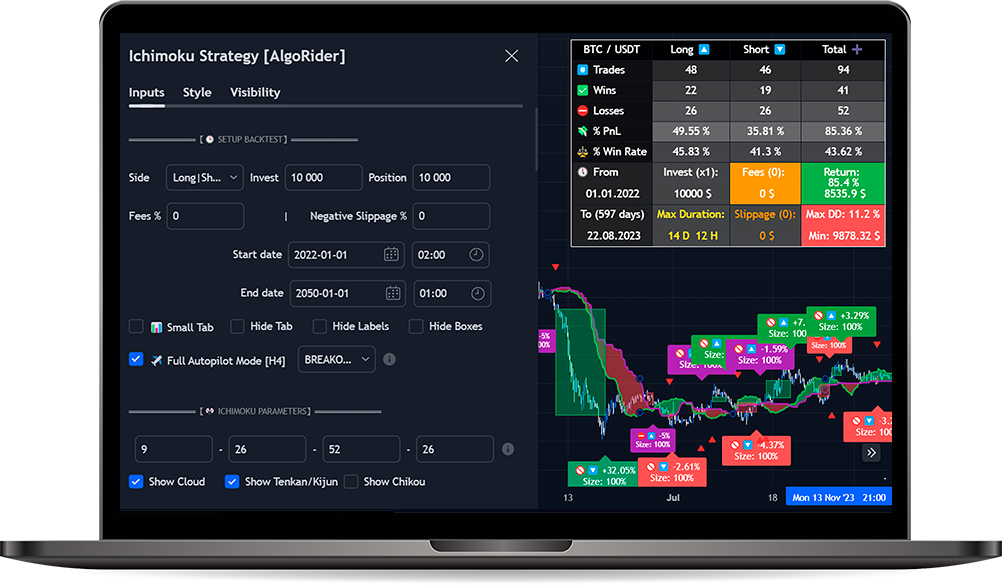
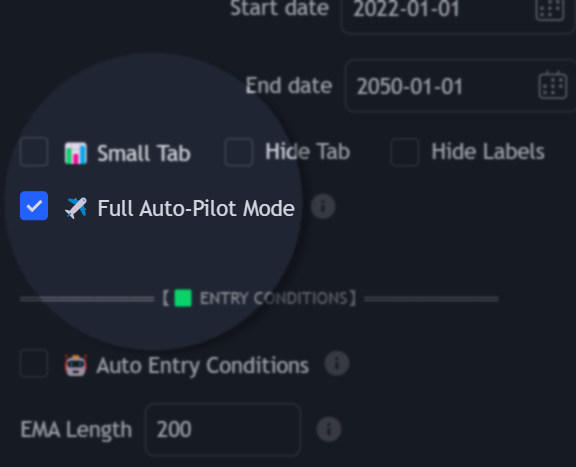
Here are the results of the Full Autopilot Mode running on 10 pairs with the AlgoRider Original strategy.
|
Year
|
Profit
|
Max Drowdown
|
Risk-Reward Ratio
|
|---|---|---|---|
|
Since 2021*
|
975.6%
|
20.7%
|
47
|
|
2024
|
178.5%
|
38.6%
|
4.6
|
|
2023
|
166.4%
|
37.7%
|
4.4
|
|
2022
|
141.1%
|
20.1%
|
7
|
|
2021
|
486.5%
|
20.7%
|
23.5
|
🔥Investing $10,000 in this strategy between 2021 and 2025 would have returned +$97,500.
The statistics above represent the application of the strategies in timeframe H8, with Autopilot settings, leverage x2, on 10 pairs at the same time: BTC, ETH, SOL, FIL, EOS, ADA, AAVE, DOT, MANA, AVAX. Always the same position size, these results are without reinvesting profits nor compound interests.
These results are supplied by our backtesting system, and are therefore verifiable at any time using our indicator on Tradingview!
The drawdown corresponds to the maximum loss recorded over a period.
*to the 1st January 2025
Here are the results of the Full Autopilot Mode SSA x SSB running on 10 pairs with the Ichimoku strategy.
|
Year
|
Profit
|
Max Drowdown
|
Risk-Reward Ratio
|
|---|---|---|---|
|
Since 2021*
|
829.2%
|
28.3%
|
29.3
|
|
2024
|
183.1%
|
28.9%
|
6.3
|
|
2023
|
211.6%
|
10.3%
|
20.6
|
|
2022
|
178.4%
|
13.6%
|
13.1
|
|
2021
|
252.4%
|
28.3%
|
8.9
|
🔥 Investing $10,000 in this strategy between 2021 and 2025 would have returned +$82,900.
The statistics above represent the application of the strategies in timeframe H4, with Autopilot settings, leverage x2, on 10 pairs at the same time: BTC, ETH, SOL, FIL, EOS, ADA, AAVE, DOT, MANA, AVAX. Always the same position size, these results are without reinvesting profits nor compound interests.
These results are supplied by our backtesting system, and are therefore verifiable at any time using our indicator on Tradingview!
The drawdown corresponds to the maximum loss recorded over a period.
*to the 1st January 2025
Backtest Up To 10 Assets Simultaneously
Backtest Reinvesting Profits
Monthly/Yearly % PnL Since 2021
Capital Evolution Over Time
Backtest Up To 10 Assets Simultaneously
Backtest Reinvesting Profits
Monthly/Yearly % PnL Since 2021
Capital Evolution Over Time
Backtest Up To 10 Assets Simultaneously
Backtest Reinvesting Profits
Monthly/Yearly % PnL Since 2021
Capital Evolution Over Time
Backtest Up To 10 Assets Simultaneously
Backtest Reinvesting Profits
Monthly/Yearly % PnL Since 2021
Capital Evolution Over Time
Backtest Up To 10 Assets Simultaneously
Backtest Reinvesting Profits
Monthly/Yearly % PnL Since 2021
Capital Evolution Over Time
Backtest Up To 10 Assets Simultaneously
Backtest Reinvesting Profits
Monthly/Yearly % PnL Since 2021
Capital Evolution Over Time
Backtest Up To 10 Assets Simultaneously
Backtest Reinvesting Profits
Monthly/Yearly % PnL Since 2021
Capital Evolution Over Time
Backtest Up To 10 Assets Simultaneously
Backtest Reinvesting Profits
Monthly/Yearly % PnL Since 2021
Capital Evolution Over Time
Let us develop your own indicator or strategy! Complete our dedicated form to give us the configuration we need to include, and we will create your indicator on demand.
Any Custom indicator will include our Advanced Backtesting sytem, and your script will be completely customizable and automatable without you having to write a single line of code.
Yes, you can try all our indicators for free for 7 days on Tradingview.
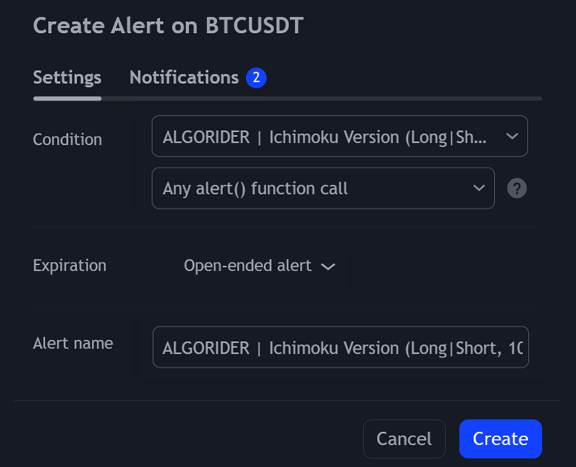
During this period you will have access to all features such as Backtesting and Signals fully automatable thanks to alerts.
We also offer free Tradingview Indicators that benefit from our own Backtesting system with known technical indicators like MACD and RSI.
You can access any of our indicators in just a few steps! And of course, you can request a 7-day trial for all of them (this trial is available once per account).
Our unique Backtesting System is really what makes our difference. Thanks to this, everyone can easily and quickly check the profitability of our strategies in the past. Also, we do not only provide signals but a complete and professional trading system which can be easily understood by a beginner with a fast automation.
Here are 3 reasons to choose our solutions:
First of all, it is impossible to predict exactly how strategies will perform in the future. It depends on several factors, the first being market conditions.
However, you can estimate your potential profits based on past data. For example:
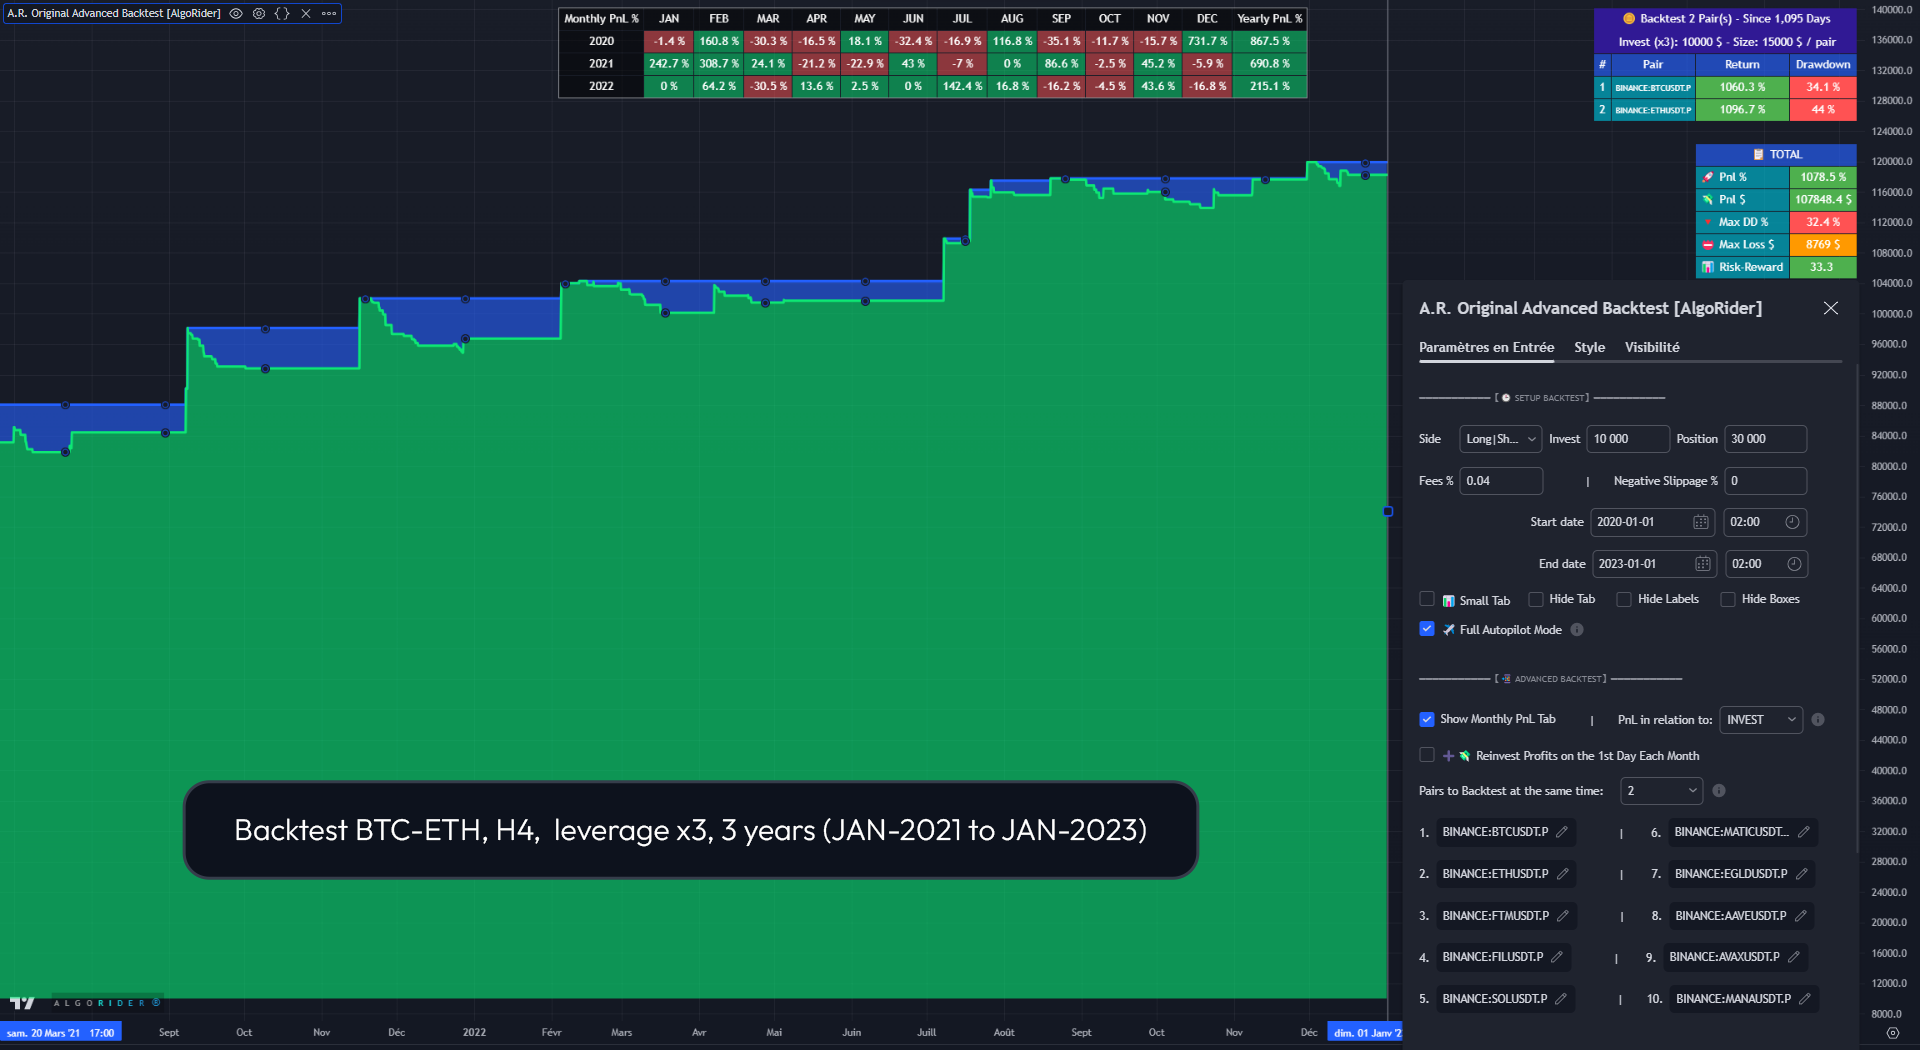
For an investment of $10,000 with Autopilot Mode in our AlgoRider Original strategy on BTC and ETH at the same time (H4), you can expect to earn $35,000 on average each year.
You can check the example backtest on BTC-ETH here.
You can check our statistics here.
In any case, keep in mind that even though there is a high probability of obtaining similar results, past results do not guarantee future results.
On our partner platform Mizar you can easily create your Trading Bot in a few minutes.
Mizar is the only Trading App with a subscription-free model that allows you to try one or more Trading Bots for free.
To run your bot on crypto markets, you will need to connect your exchange account to Mizar, to have a Tradingview account, and to get access to one of our indicators. Once these steps are done, it will take you less than 3 minutes to create a bot and run it.
If you do not want to create and configure your own bot, you can copy our trading bots on Mizar or invest in our fully automated Zignaly strategy.
For a rapid answer,
contact us on our Discord!

⚠️ To use this calculator, please keep the website in its original language (English).
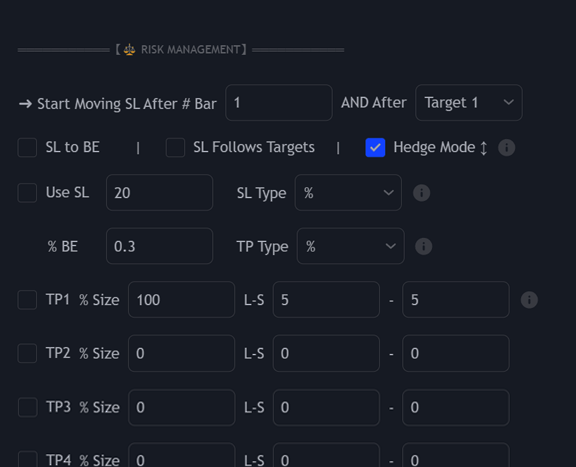
⚠️ WARNING: An Expected Max Drawdown above 50% is not recommended for proper risk management. ⚠️
The multiplier used in the formula (not to be confused with leverage) is the factor by which the base performance of the strategy is scaled. The base performance — calculated using normalized position sizing, meaning each trade is executed with the same fixed size — yields, on average, a +15% annual return (APR) with a maximum drawdown of 5%.